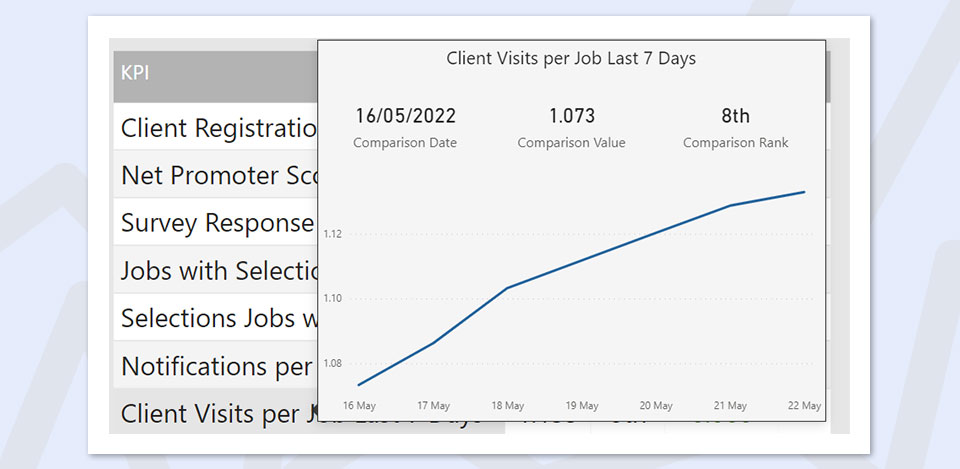
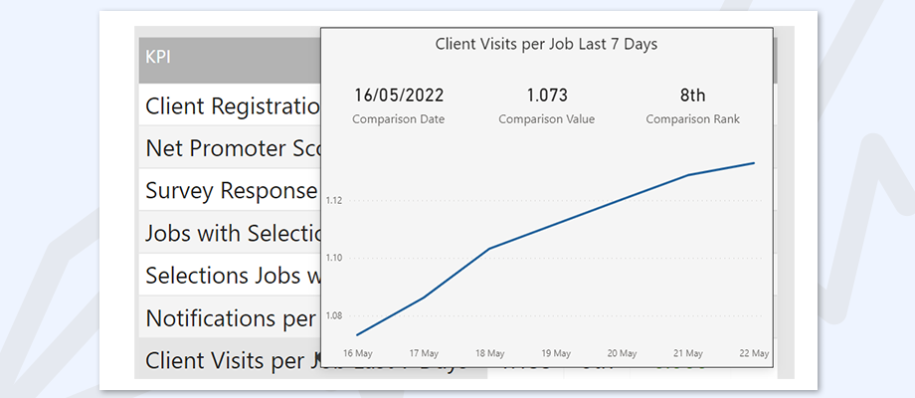
With the release of Intelligence 1.5.2, we’re bringing you some new Online Engagement KPIs to help you track the number of emails and client visits per job over the last seven days.
Online Engagement KPIs provide data insights to map your competitive position next to other builders using Constructive, as well as tracking how this position changes over time. You can use this as a tool to benchmark your online engagement, set goals and identify opportunities to improve your position with our expert tips on how to increase Notifications and Client Visits per job, (linked next to each KPI within the table).
We’ve also added two columns to the Job Details table to help you uncover more data around when clients are logging into their Portal.
1. Online Engagement Key Performance Indicators Additions
Notifications per Job Last 7 Days
Reports the average number of emails per job in the last seven days. Restricted to Sales, Preconstruction and Construction Jobs.
Client Visits per Job Last 7 Days
Reports the average number of days the client logged in per job in the last seven days. Restricted to Sales, Preconstruction and Construction Jobs.

2. Job Details Table Additions
Total Logins (days)
Shows the total number of days the client has logged into their Customer Portal.
Logins Last 7 Days
Shows the number of days the client has logged in to their Customer Portal in the last seven days.
